5.10 Use and modify sample analysis metadata
The analysis information section briefly introduced the incorporation of sample metadata. For instance, consider the following analysis information for a degradation experiment:
# create analysis information: for demonstrative purposes we just base it on the example data
anaInfoMeta <- anaInfo
anaInfoMeta$experiment <- c("UV", "UV", "H2O2", "H2O2", "O3", "O3")
anaInfoMeta$exposure <- c(0, 10, 20, 30, 0, 10) # time in minutes
anaInfoMeta[, c("analysis", "experiment", "exposure")]
#> analysis experiment exposure
#> 1 solvent-pos-1 UV 0
#> 2 solvent-pos-2 UV 10
#> 3 solvent-pos-3 H2O2 20
#> 4 standard-pos-1 H2O2 30
#> 5 standard-pos-2 O3 0
#> 6 standard-pos-3 O3 10As briefly mentioned before, the analysisInfo() function can be used query the analysis information of a workflow object.
# fGroupsMeta is a feature groups object with the anaInfoMeta as analysis information
analysisInfo(fGroupsMeta)[, c("analysis", "experiment", "exposure")]
#> analysis experiment exposure
#> <char> <char> <num>
#> 1: solvent-pos-1 UV 0
#> 2: solvent-pos-2 UV 10
#> 3: solvent-pos-3 H2O2 20
#> 4: standard-pos-1 H2O2 30
#> 5: standard-pos-2 O3 0
#> 6: standard-pos-3 O3 10The ni argument can be used to easily subset a features and feature groups objects. It works very similar as subsetting a data.table with the i argument.
#> [1] "solvent-pos-3" "standard-pos-1"#> [1] "solvent-pos-3" "standard-pos-1"# we can also use standard analysis information columns
analyses(fGroups[ni = replicate == "standard-pos"])#> [1] "standard-pos-1" "standard-pos-2" "standard-pos-3"The anaInfoCols argument can be used to add metadata to the output table generated by as.data.table() (and as.data.frame()).
as.data.table(fGroupsMeta, features = TRUE, anaInfoCols = c("experiment", "exposure"))[1:5, .(group, analysis, anaInfo_experiment, anaInfo_exposure)]#> group analysis anaInfo_experiment anaInfo_exposure
#> <char> <char> <char> <num>
#> 1: M99_R14_1 solvent-pos-1 UV 0
#> 2: M99_R14_1 solvent-pos-2 UV 10
#> 3: M99_R14_1 solvent-pos-3 H2O2 20
#> 4: M99_R14_1 standard-pos-1 H2O2 30
#> 5: M99_R14_1 standard-pos-2 O3 05.10.1 Grouping and aggregating data
The analysis metadata can also be used to group and aggregate data. This is especially useful if you quickly want to compare different groups of analyses. The following functions support this:
| Functions | Argument | Remarks |
|---|---|---|
as.data.table(), plotInt() |
average |
Averages intensities from analyses grouped by metadata. |
unique(), overlap(), plotVenn(), plotUpSet(), plotChord() |
aggregate |
Compares analysis groups defined by metadata. |
plot(), plotInt(), plotChord(), plotChroms() |
groupBy |
Groups data in plots. |
Some examples are shown below.
#>         group       ret        mz UV_intensity H2O2_intensity O3_intensity
#>        <char>     <num>     <num>        <num>          <num>        <num>
#> 1:  M99_R14_1 13.643769  98.97530       363518         325318       297774
#> 2:   M99_R4_2  4.448981  98.97535       114428         144348       113840
#> 3:  M100_R7_3  7.042372 100.11197       349810         283356       278576
#> 4:  M100_R5_4  5.020052 100.11198            0              0        41400
#> 5: M100_R28_5 27.729320 100.11203       302680         303282       275468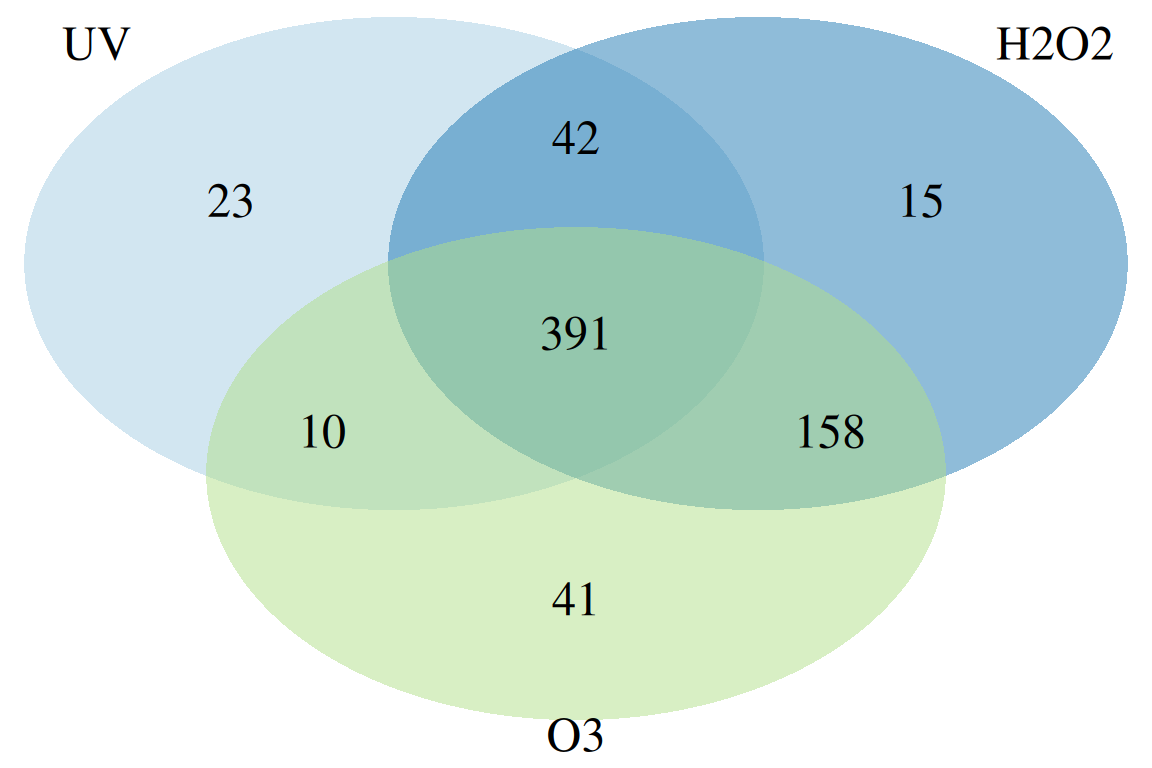
plotChord(fGroupsMeta, aggregate = FALSE, groupBy = "experiment") # group feature overlap by experiment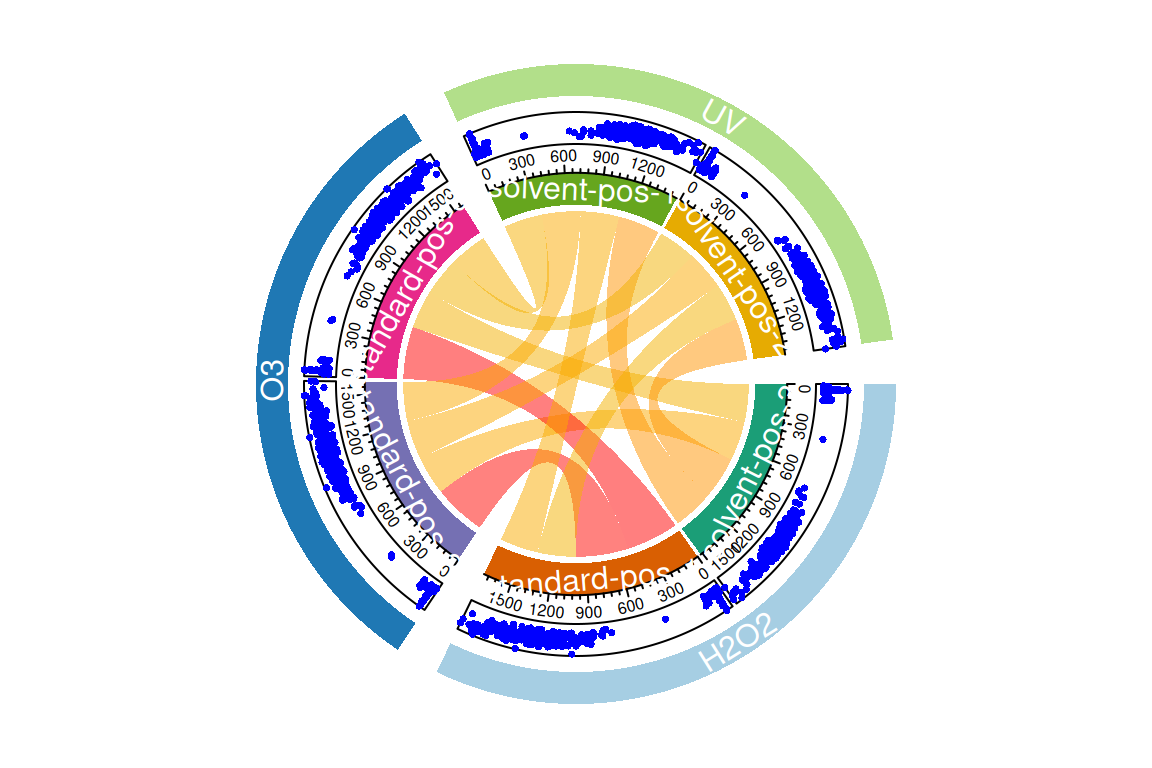
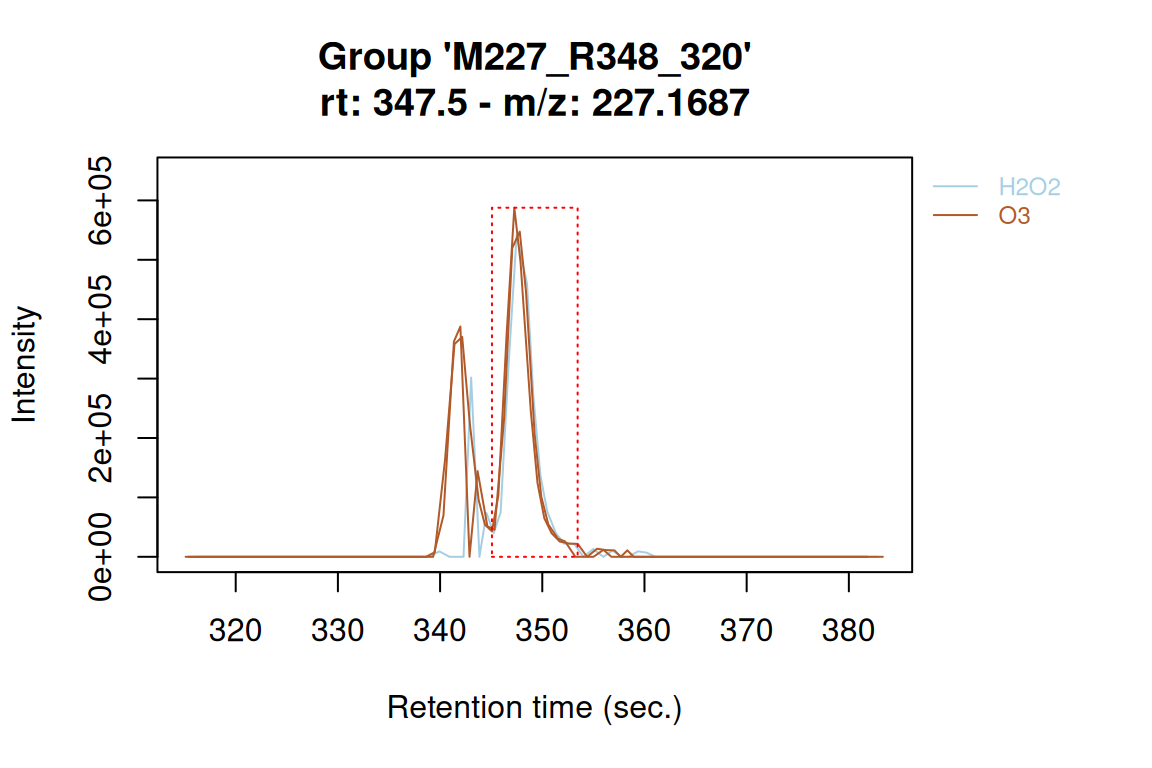
plotChroms(fGroupsMeta[, 320], groupBy = "experiment", showLegend = TRUE) # EICs grouped by experiment#> Using 'mzr' backend for reading MS data.
#> ================================================================================
5.10.2 Modifying analysis information
The analysis information in features and featureGroups objects can be modified with in two ways. The first is to use the subset operator ([]) to re-order the analyses within the object. This may be useful, for instance, to change the order in plots:
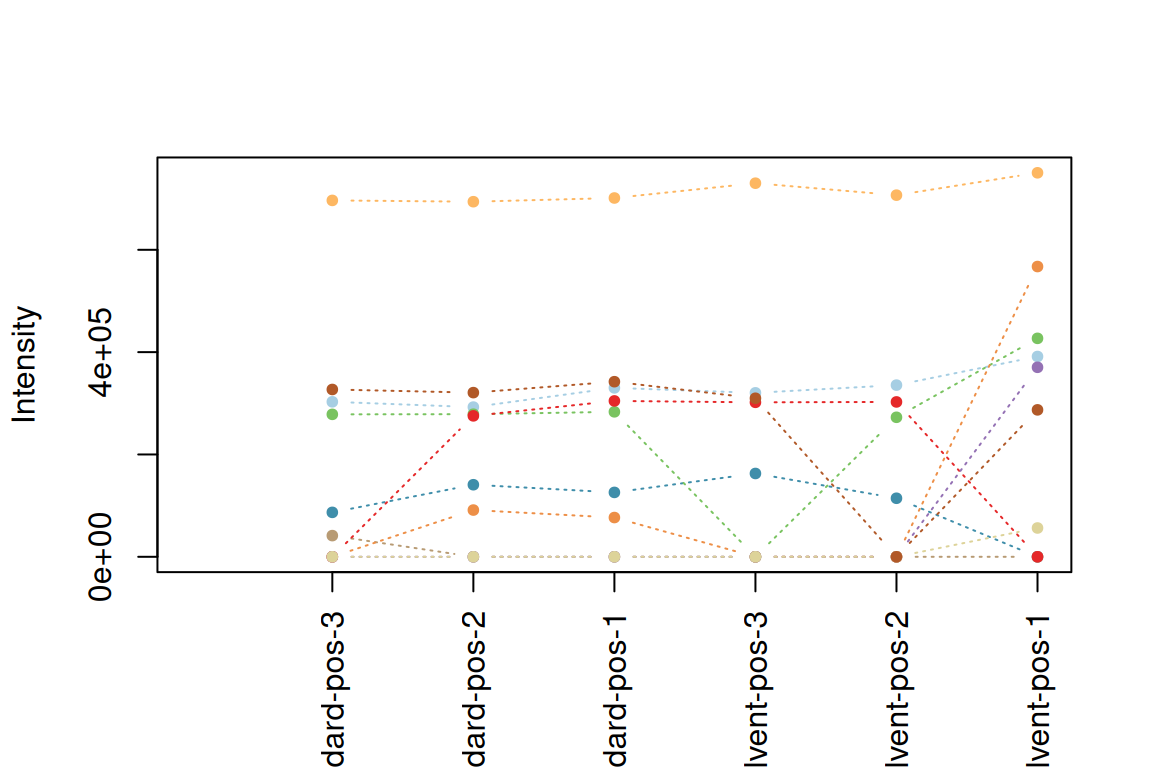
fGroupsToPlot <- fGroupsMeta[, 1:10]
plotInt(fGroupsToPlot, average = FALSE) # default order
fGroupsReverse <- fGroupsToPlot[rev(analyses(fGroupsToPlot)), reorder = TRUE]
plotInt(fGroupsReverse, average = FALSE) # reversed order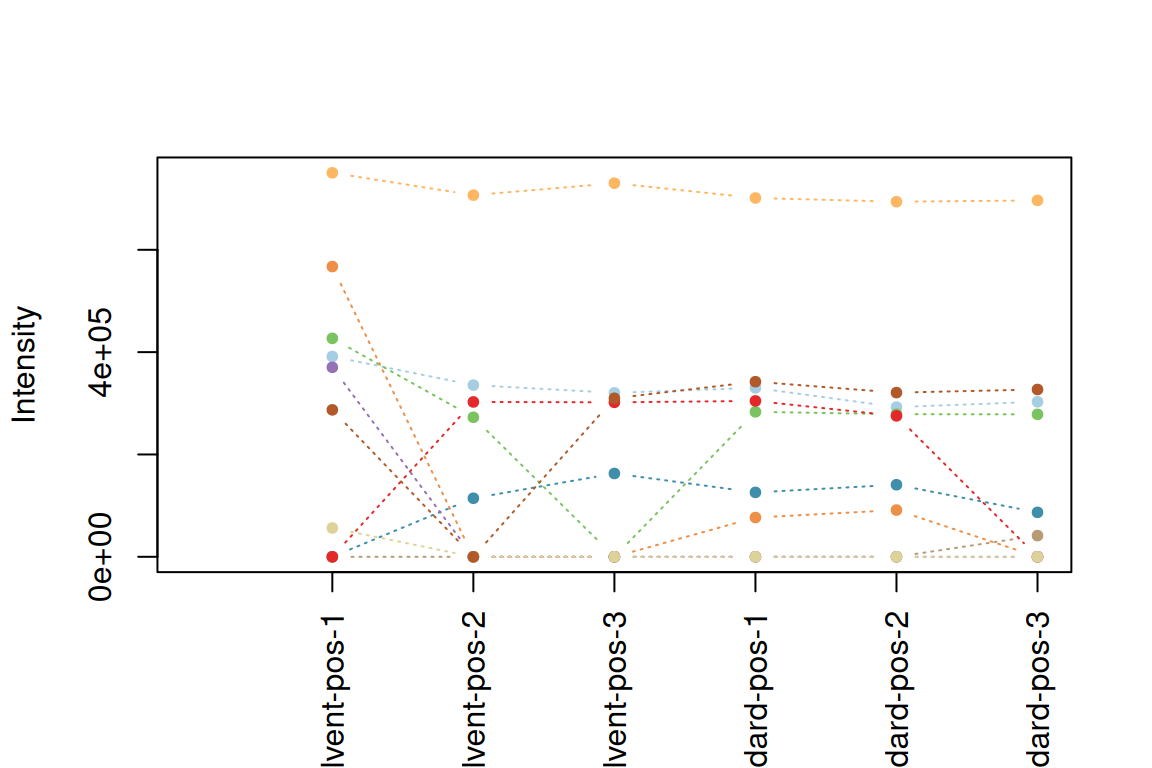
The second option is to modify the analysis information table itself by using the analysisInfo()<- assignment method function.
# add pH column
analysisInfo(fGroupsMeta)$pH <- c(7.0, 7.0, 3.5, 3.5, 2.0, 2.0)
analysisInfo(fGroupsMeta)[, .(analysis, experiment, exposure, pH)]
#> analysis experiment exposure pH
#> <char> <char> <num> <num>
#> 1: solvent-pos-1 UV 0 7.0
#> 2: solvent-pos-2 UV 10 7.0
#> 3: solvent-pos-3 H2O2 20 3.5
#> 4: standard-pos-1 H2O2 30 3.5
#> 5: standard-pos-2 O3 0 2.0
#> 6: standard-pos-3 O3 10 2.0# and remove it: take a copy, modify and replace it
tab <- data.table::copy(analysisInfo(fGroupsMeta))
tab[, pH := NULL] # remove pH column
analysisInfo(fGroupsMeta) <- tab
colnames(analysisInfo(fGroupsMeta)) # check if column is removed#> [1] "analysis" "path_centroid" "path_raw" "path_profile" "path_ims" "replicate" "blank" "experiment" "exposure"NOTE The analysis information is internally stored as a
data.table. Do not attempt to modify it directly with the reference assignment operator (:=) ofdata.table. Instead, alter a copy and replace the table, as demonstrated by the second example above.
The analysisInfo()<- function can be used to add, remove or modify any metadata in the analysis information. It is also possible to change other columns such as the replicate or blank columns. However, it is currently not possible to modify the analysis column. Finally, the table rows can be re-ordered to change the order of analyses in the object.