6.4 Processing data
All data objects that are generated during a sets workflow inherit from the classes from a ‘regular’ workflow. This means that, with some minor exceptions, all of the data processing functionality discussed in the previous chapter (e.g. subsetting, inspection, filtering, plotting, reporting) is also applicable to a sets workflow. In addition, data from sets workflows also bring some additional data processing functionality. Some examples:
# only keep feature groups that have positive data
fGroupsPos <- fGroups[, sets = "positive"]
# only keep feature groups with features present in all sets
fGroupsF <- filter(fGroups, relMinSets = 1)
#> Applying minimum sets filter... Done! Filtered 3407 (88.84%) features and 809 (94.07%) feature groups. Remaining: 428 features in 51 groups.# In sets workflows, the m/z values of features are 'neutralized', the `ion_mz` columns contains the original 'ionized' m/z values.
as.data.table(fGroups)[1:5, c("group", "mz", "ion_mz-positive", "ion_mz-negative")]#> group mz ion_mz-positive ion_mz-negative
#> <char> <num> <num> <num>
#> 1: M98_R7_1 97.96702 NA 96.95974
#> 2: M98_R30_2 97.96708 NA 96.95981
#> 3: M98_R10_3 97.96709 NA 96.95981
#> 4: M98_R5_4 97.96769 98.97497 96.96042
#> 5: M98_R14_5 97.96787 98.97515 96.96060# Inspect set specific data.
as.data.table(compounds)[1:5, c("group", "score-positive", "score-negative", "compoundName", "set")]#> group score-positive score-negative compoundName set
#> <char> <num> <num> <char> <char>
#> 1: M198_R317_273 3.5190115 4.569478 3-(4-chlorophenyl)-1,1-dimethylurea positive,negative
#> 2: M198_R317_273 2.5198763 1.563191 5-[[(2R)-azetidin-2-yl]methoxy]-2-chloropyridine positive,negative
#> 3: M198_R317_273 1.2528529 1.350556 1-(3-chloro-4-methylphenyl)-3-methylurea positive,negative
#> 4: M198_R317_273 1.1469202 1.276057 3-(3-chlorophenyl)-1,1-dimethylurea positive,negative
#> 5: M198_R317_273 0.9981602 1.127297 1-(4-chlorophenyl)-3-ethylurea positive,negativeIn sets workflows the analysis information is amended with a set column to specify the set each analysis belongs to. Just like other columns in the analysis information, the set column can be used to group and aggregate data:
# only keep feature groups with features present in both polarities
fGroupsPosNeg <- overlap(fGroups, which = c("positive", "negative"), aggregate = "set")
# only keep feature groups with features that are present only in positive mode
fGroupsOnlyPos <- unique(fGroups, which = "positive", aggregate = "set")

plotVenn(fGroups, aggregate = "set", margin = 0.1) # compare positive/negative features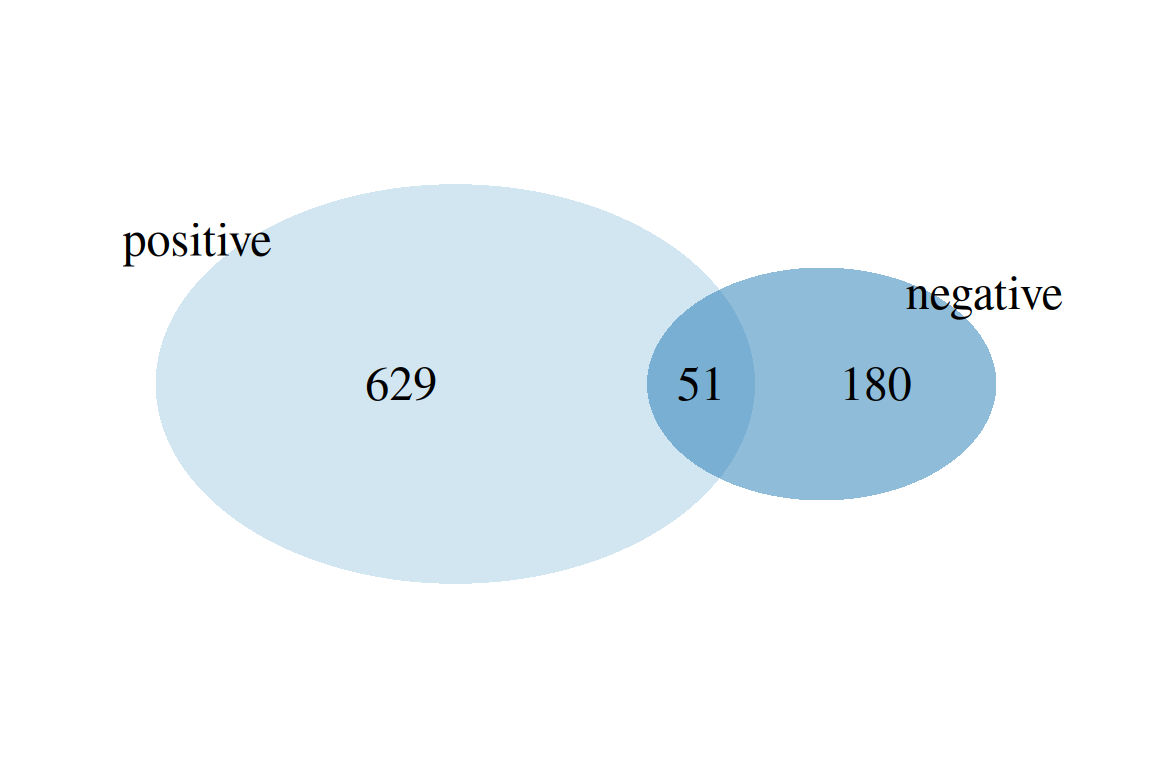
plotChord(fGroups, aggregate = TRUE, groupBy = "set") # compare replicate aggregated positive/negative features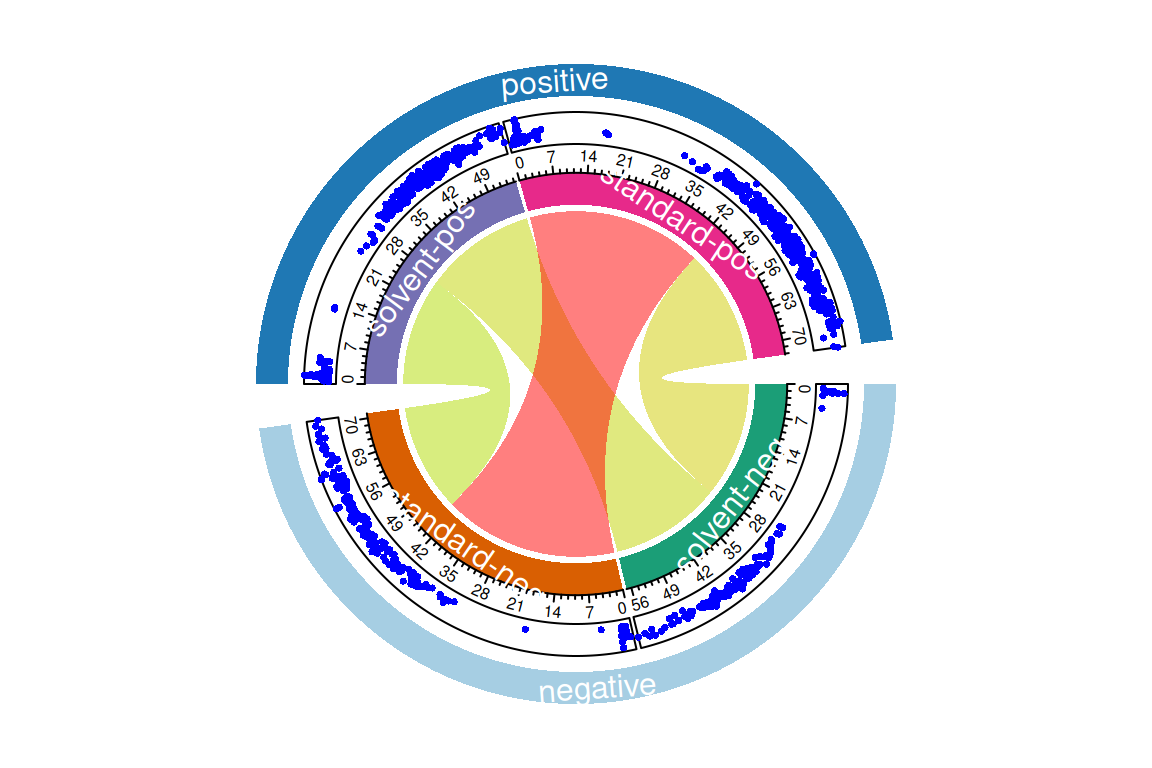
# plot annotated positive/negative mirror spectrum
plotSpectrum(compounds, index = 1, groupName = "M198_R317_273", MSPeakLists = mslists,
             plotStruct = TRUE)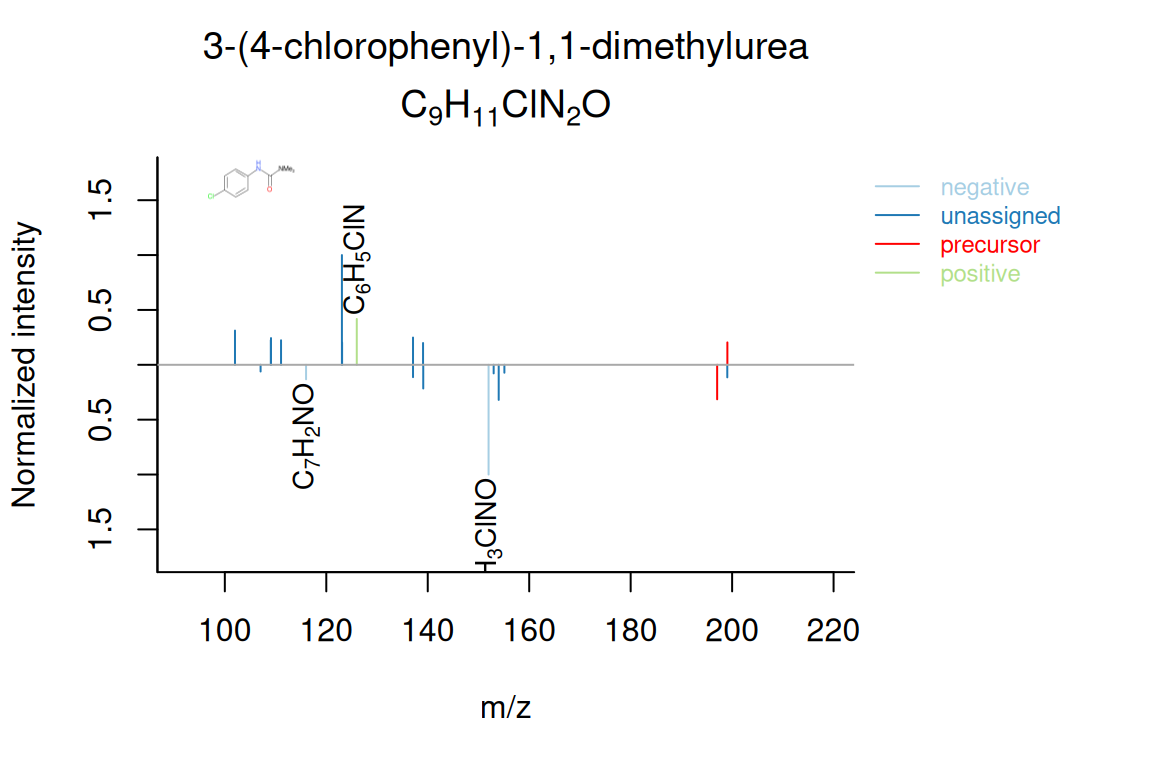
The reference manual for the workflow objects contains specific notes applicable to sets workflows (?featureGroups, ?compounds etc).